Key Takeaways
- Index concentration does not imply an impending pullback, but elevated P/E ratios highlight the importance of maintaining a diversified portfolio
- Although recent inflation prints have been higher than expected, the Federal Reserve remains committed to getting inflation to its 2% target, even if the road may be longer
- A unique opportunity to maximize the amount of wealth that can be tax-efficiently passed to heirs will expire at the end of 2025. We explain why 2024 is an ideal year to prioritize your wealth transfer plans
Stock Market Concentration
The S&P 500 Index has become undeniably top heavy with the top 10 stocks representing 33.5% of the Index’s market capitalization at the end of Q1. To put this in historical perspective, this level of concentration is quite high but not the highest it’s ever been. That distinction belongs to the 1960s when the top 10 stocks accounted for over 40% of the Index. Concentration in and of itself does not necessarily imply a bubble, however. Context matters, and stock valuations are a better indicator of frothiness in markets than index concentration.

Source: FactSet, Standard & Poor’s, J.P. Morgan Asset Management.
Despite the Index currently being more concentrated than at the peak of the dot-com bubble, the earnings contribution of the top 10 companies today is also greater than it was at that time. When looking at price-to-earnings (P/E) ratios, the top 10 stocks today are trading at 28x earnings. During the dot-com bubble, this number peaked above 40. The relatively lower multiples today are in large part due to the earnings growth of the “Magnificent 7”, the nickname given to the current top technology stocks in the S&P 500. Their combined earnings grew 31% in 2023 while the rest of the Index’s earnings contracted 4%.

Source: FactSet, Standard & Poor’s, J.P. Morgan Asset Management.
With that said, a P/E ratio of 28 is historically on the high side for the top 10 stocks, about 140% above average. The Index as a whole is trading at 21x earnings, which is around 1.3 standard deviations above its 30-year average. By no means does this signal a pullback is imminent, but it does say stocks are indeed getting expensive. The below chart shows forward P/E ratios vs subsequent 1 and 5-year returns. In the short term, one year in this case, P/E ratios do not have much predictive power in terms of returns, however, this relationship tightens up as you extend out to longer time frames. If history is a guide, current valuations could act as a headwind to stock returns in the coming years. Stocks are only part of the equation for multi-asset investors though. After enduring the pain of the last two years of interest rate hikes, the outlook for fixed income looks substantially better today than it has in the last few years, and with bonds acting like bonds again, diversified investors are still well-positioned today.

Source: FactSet, Refinitiv Datastream, Standard & Poor’s, Thomson Reuters, J.P. Morgan Asset Management.
Returns are 12-month and 60-month annualized total returns, measured monthly, beginning 1/31/1999. R² represents the percent of total variation in total returns that can be explained by forward price-to-earnings ratios. Price-to-earnings is price divided by consensus analyst estimates of earnings per share for the next 12 months as provided by IBES since February 1998 and by FactSet since January 2022.
An Update on the Fed – Has the Story Changed?
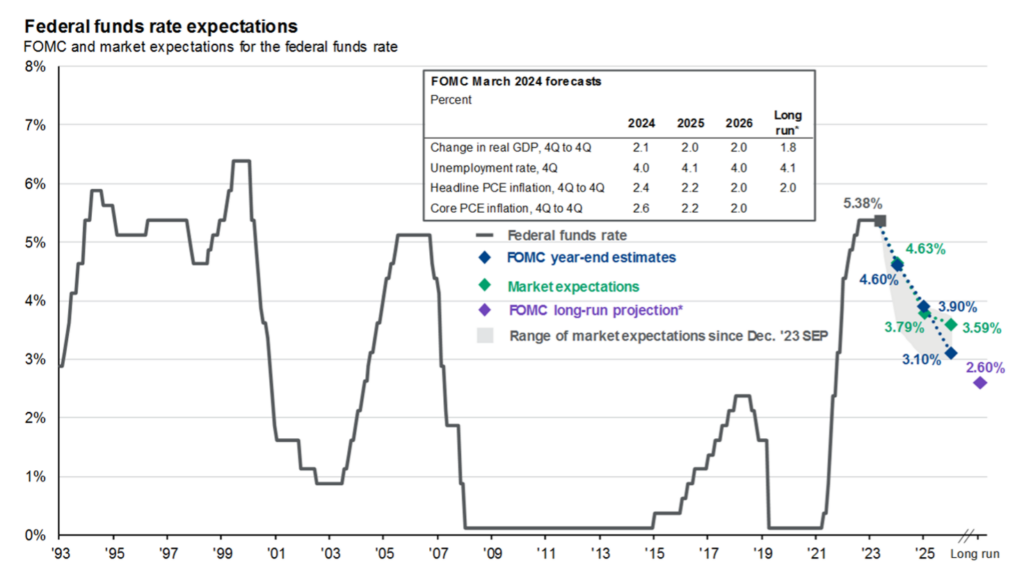
As expected, the Federal Open Market Committee (FOMC – rate deciding committee of the Federal Reserve) decided to maintain the target range of 5.25% and 5.50% for the federal funds rate during its March meeting. The statement released by the committee remained mostly unchanged, with minor modifications recognizing the recent robustness of the labor market. Additionally, the committee reiterated that inflation has decreased but remains high. Relative to the committee’s December forecast, updates to the Summary of Economic Projections signaled a rosier outlook for the economy in the year ahead. Year-end inflation was revised up to 2.6% from 2.4%, and 2024 growth was revised up to 2.1% from 1.4%. This led to the FOMC projecting one fewer rate cut for next year, for a total of three cuts in 2025 and 2026. They continue to show three rate cuts for this year.
Since the last FOMC meeting, recent reports on the macro environment over the past two months have presented a mixed picture. Inflation readings have exceeded expectations, while retails sales have fallen short. Investors have begun to ask whether the story has changed on how the Fed treats inflation. According to Powell’s recent press conference, he emphasized that inflation is still running above the Fed’s target and in order to cut rates, they will need to see inflation “moving sustainably towards 2%”. Despite some hotter inflation prints, inflation has cooled substantially from where it was before, but that ride down to 2% will take some time and be bumpy. The Fed committee views current policy rates as restrictive, which should allow inflation to return to trend over time. However, they will be cautious about cutting rates prematurely if growth remains strong and labor markets remain tight.

Source: Bloomberg, FactSet, Federal Reserve, J.P. Morgan Asset Management.
We May Never See a Better Environment for Transferring Wealth…Here’s Why
