By: Tenny Chen
Eating salad for dinner, taking a yoga class, reading an informative blog… As individuals, we seek continuous improvement for a better self, and it is the same for every successful business. Business performance evaluations are crucial for such improvement. Such assessments provide insights to identify current strengths and weaknesses, help with strategic decision-making, allow management to set and monitor goals, and many other vital tasks.
Luckily, there are many ways to evaluate business performance. Some of the most common ways are to compare financial statements by period and monitor key performance indicators (KPIs). Your KPIs can be anything quantifiable depending on the business’ industry (e.g., profit margin, net multiplier, employee turnover, system uptime). You may also want to dig into sales and customer aspects.
However, as your business grows, the various ways to evaluate performance can become cumbersome. Clients approach me with Excel workbooks containing 50+ tabs, carefully linking calculations tab by tab for each product and each month. While I respect their delicate and detailed work, there are more accessible and more time-efficient ways to assemble the picture.
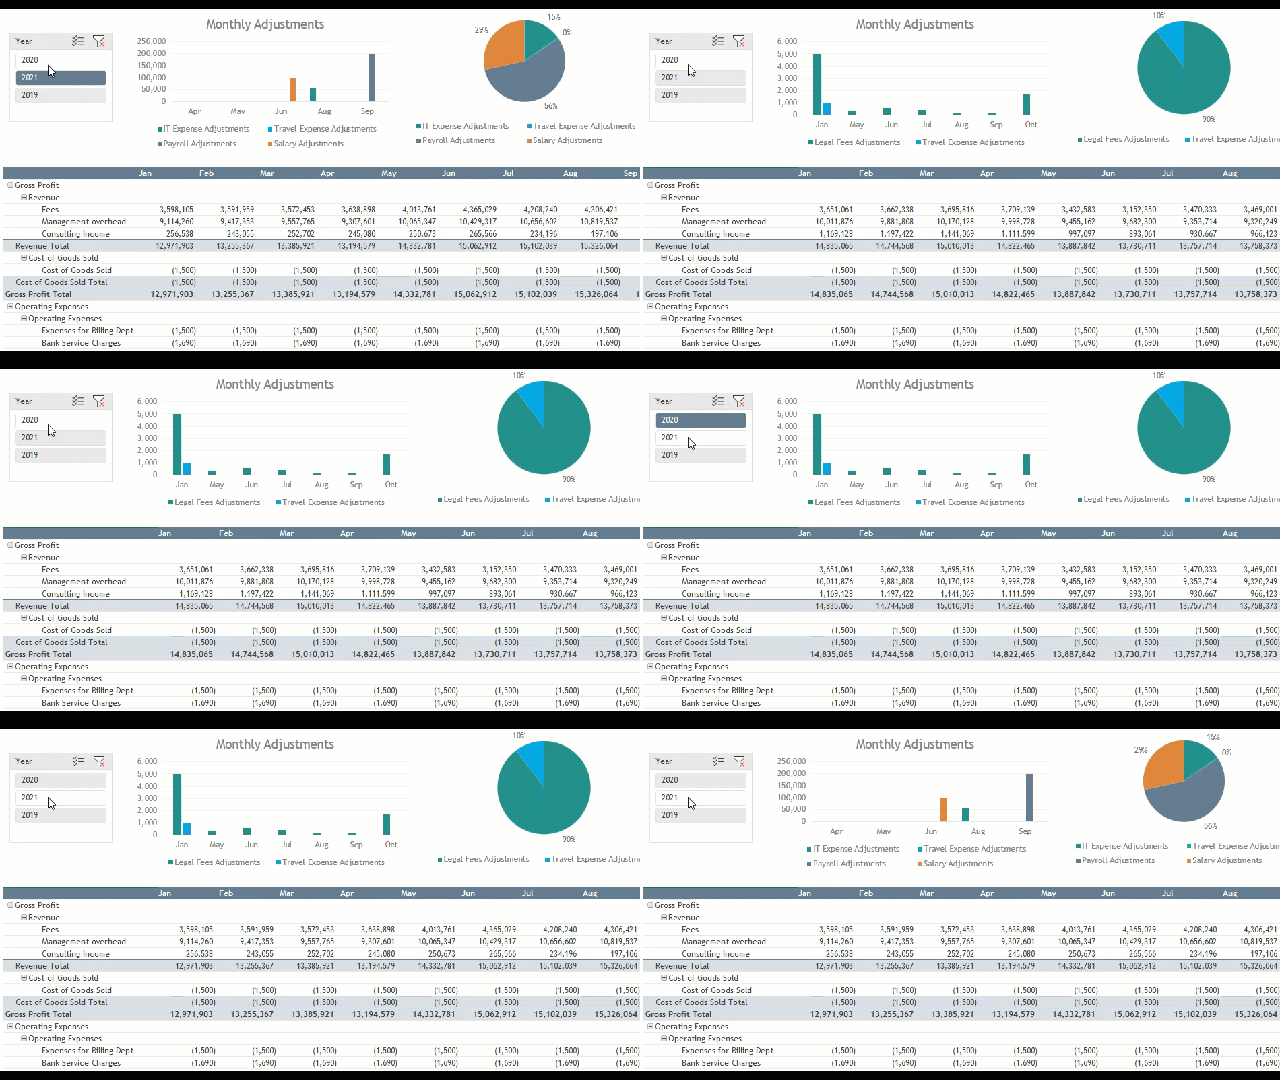
If you are a big Excel-lover and only need simple analysis, you can stay in Excel while utilizing its handy Power Pivot tool. Power Pivot allows you to create a relational database inside Excel and can combine and handle millions of rows of data. The source data need not come from one workbook; it can also come from a local or online folder, PDFs, another database, or online services. Once you have decided on the appropriate metrics, you can build interactive and dynamic reports and dashboards.
All queries/steps you have built out (like combine, merge, aggregate etc.) are applicable across multiple data sources, ensuring consistency and increasing efficiency. I usually keep all transformed data in the backend data model and only pull out tables and graphs relevant to the analysis. This way, we keep the worksheets clean.

(Sample interactive dashboard in an Excel worksheet)
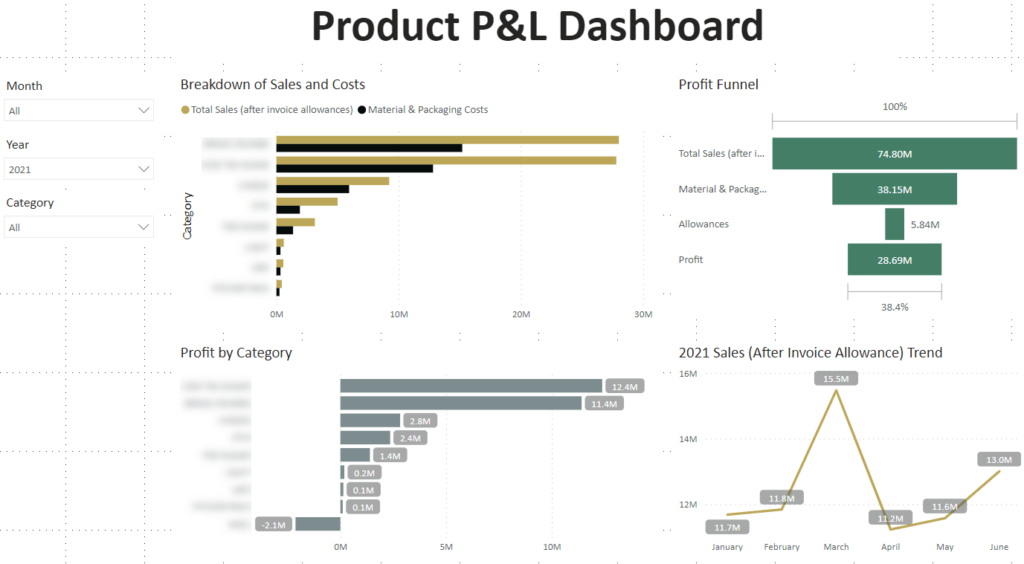
If you want to go to the next level (for example, using real-time reporting), then Power BI could be a great option. Power BI dashboards look appealing with presentation-ready graphics (you can share them with a link), support complex data relationships, and allow you to drill down for more detailed views. Like Power Pivot, you can connect to multiple data sources and create customized calculations. Power BI also has direct query and incremental refresh modes, allowing you to see live data with faster refreshing speeds. Even more exciting is that your Power BI may be free to use. It comes with free pro and premium versions, so the cost varies depending on your needs.

(Sample Power BI Dashboard for Product Analysis)
Using Power Pivot and Power BI to speed up the business evaluation process is no longer a secret. Many of our clients use them to automate most preparing and reporting procedures – it saves time and presents results in a more organized manner. If your analysis is still based on tedious copying, pasting, and relinking formulas, or if you spend a lot of time tracing down one number from a bunch of historical folders, it is time for a POWERful change.
Please get in touch with our Technology Advisory Team team if you need help or have any questions. If you are already a big Power Pivot and Power BI fan, here are some of my personal favorite sites:
