By: Ian Tobin
NetSuite is a powerful ERP system that thousands of companies use to run their business. In the vast ocean of data stored within NetSuite, many valuable insights remain untapped due to underutilized dashboard capabilities. While canned KPIs and Scorecards provide a solid foundation, they often fail to offer the segmentation and customization that businesses need. As a result, numerous NetSuite users aren’t getting the full benefits of dashboards. By harnessing the power of custom-saved searches and workbooks, you can create tailored metrics and unlock a deeper level of data insight. This blog post will explore using these tools to build effective and targeted NetSuite dashboards that drive informed decision-making.
Custom Saved Searches
As mentioned, NetSuite comes with many canned KPIs that can be used on dashboards. Generally, these KPIs are very broad and provide metrics at the highest level without much segmentation. We can utilize saved searches to create custom KPIs which can then be added to your dashboard.
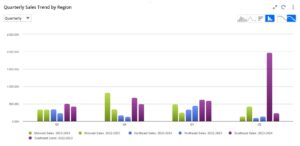
In the example below, we are utilizing the Trend Graph portlet with custom KPI’s. You can add up to three KPI’s to Trend Graphs in NetSuite.

The KPIs’ data source consists of custom-saved searches, and the criterion for each search is limited to sales transactions in specific locations. This allows us to dive more deeply than the canned “Sales” KPI. Some portlet settings are also adjusted on this trend graph to provide a comparative view by Quarter.
The KPI Scorecard portlet also allows the use of custom KPIs. Custom-saved searches provide a snapshot of Net Income with variance in this example.

Normally, a user would need to run a much larger comparative income statement report to see this. However, using saved searches, we can extract this information from your data, customize formulas, and place it on your dashboard so it’s easily viewable.
Analytics Workbooks
Another option for dashboard visuals is SuiteAnalytics Workbooks. Workbooks are an alternative to saved searches that offer additional visualization options such as pivot tables. Workbook visuals can be added to your dashboard using the “Analytics” portlet.
You first need to create a dataset. Datasets are the data source for the visuals in your workbook. You can also join multiple datasets in one workbook, which provides robust analysis potential. A perfect example of this is budget and transaction data. The Budget vs. Actual report is a standard report in NetSuite. However, saved searches of the budget record type cannot be used in trend graphs and function poorly in KPI portlets, unlike transaction searches.
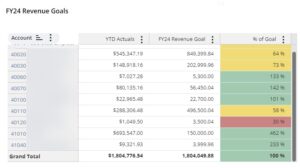
The example below is a pivot table visual from SuiteAnalytics Workbooks.

Here, two separate datasets were created: one for transaction data and another for budgets. These datasets were joined, enabling the inclusion of fields from both sources. Additionally, you can create calculated columns for your visuals. For instance, the ‘% of Goal’ column displays the percentage of the fiscal year goal (budget) that has been achieved. Conditional formatting can also be applied (as seen in the ‘% of Goal’ column) to provide a snapshot of financial performance. Like the KPI scorecard net income example, you would need to run an entire budget vs. actual report to get this information. Visuals like these provide insight to management without always needing to run a report.
The examples above are just scratching the surface of what is possible. With saved searches and workbooks, you can build dashboard content for essentially any transaction or record type. Tapping into this functionality will transform your dashboards from high-level overviews to targeted metrics that drive decision-making and efficiency. At Wiss, we can help you unlock the full potential of NetSuite dashboard capabilities to drive your business forward. Our team of experts will work with you to design and implement customized solutions that ensure you get the most out of your NetSuite investment.

 Previous


