By: Wiss Wealth Management Team
KEY TAKEAWAYS
- How does this recent market selloff compare to historical trends and what can it mean for future returns?
- The Fed held rates steady at its most recent meeting, but made major changes to their language, signaling a dovish tone and inflation progress.
Insights on Current Market Volatility
Although we have seen a slight recovery, the stock market experienced a sharp sell-off from the first day of August to earlier this week. This was accompanied by a significant increase in volatility, as evidenced by a spike in the VIX index to 60 before settling back down to around 27 (the VIX is a measure of volatility, with levels above 20 indicating higher than normal volatility). In this market update, we will explain how this current pullback and market volatility compare to historical trends, and what implications this has for future returns.
Since we hit peak inflation in June 2022, the market has been living with the mantra that “bad news is good news”. This has been based on the belief that data on a slowing economy would give the Federal Reserve (Fed) clearance to cut interest rates. However, we seem to have suddenly moved to “bad news is bad news” as evidenced by recent market volatility. Some of the recent headlines that have contributed to this are:
- Weak payroll employment report on Friday, August 2nd – led to worries of a “hard landing” caused by the Fed’s higher for longer policy stance.
- Unwinding of yen carry trades following the Bank of Japan’s rate hike and hawkish tone.
- Concerns over rising Middle East tensions involving Israel and Iran
- U.S. political uncertainty following President Biden’s withdrawal from the 2024 election.
- Negative seasonality – August is typically one of the weaker months in recent years.
- Frothy sentiment and stretched valuations.
Market movements are not caused by one simple reason, as evidenced by these recent headlines. Numerous factors must coalesce and create the perfect recipe for a meaningful pullback or correction. Sharp declines in equity prices can be worrisome, but historical data on the S&P 500 index shows that dips, pullbacks, and corrections of 10% or more are a natural and necessary part of any bull market.
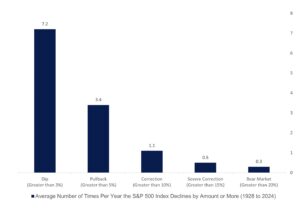
Stocks typically experience a pullback of over 5% three times a year on average and a correction of 10% or more once a year, even in positive years. To put it differently, 94% of years since 1928 have had a pullback of at least 5%, and 64% of years have experienced at least one 10% correction. These occurrences are common, which means one should remain patient, stay invested, and most importantly, not panic.
Number of Dips, Pullbacks, and Corrections on Average Per Year

Source: LPL Research, Ned Davis Research 08/02/24
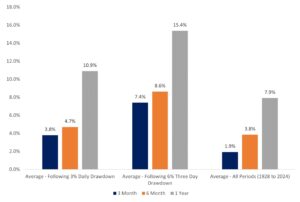
Investors seeking positive signals amidst the recent sell-off in the market may find them in the analysis of forward returns following a daily drawdown of greater than 3% or a three-day drawdown of greater than 6%. Since 1928, there have been 354 days when the S&P 500 experienced a 3% or greater daily drawdown, and the average and median 3-month, 6-month, and one-year forward returns have been higher than the long-term averages. Furthermore, after a 3-day drawdown of 6% or more, which we recently experienced, the returns are even stronger, with the average return in the next year being over 15%.
Forward Returns After Drawdowns

Source: LPL Research, S&P Dow Jones Indexes, Bloomberg, Factset 08/05/24
Elevated volatility and stock market drawdowns can be unsettling, especially after periods of calm. In many ways, however, this volatility is the price of admission to the stock market’s positive returns over most intermediate to long time periods. While it is justifiable to remain cautious, various analysts have highlighted potential reasons to remain calm:
- Signals from the Fed that they may be more aggressive with rate cuts.
- Other economic data points (i.e., strong GDP or retail sales numbers) that signal the economy is holding up well.
- Corporate fundamentals – analysts expect low double-digit growth for the S&P 500 this year, and mid to high single digits in 2025.
As the economy continues to work through challenges, investors should expect above average volatility. This volatility in the short term can provide a chance to strategically add to your portfolio and can provide additional tax loss harvesting opportunities. See our previous blog post for insights on this.
The Latest on the Fed and Inflation
At its most recent meeting on July 31st, the Federal Open Market Committee (FOMC), the Fed’s rate setting committee, voted to leave the Federal funds rate unchanged at a target range of 5.25% to 5.50%. However, they hinted at rate cuts on the horizon. The initial paragraphs of the statement underwent some changes. The description of the labor market was toned down, acknowledging that job gains have slowed, and that the unemployment rate has increased, albeit remaining low. Additionally, the FOMC adjusted their language on progress towards inflation, replacing the word “modest” with “some”. These minor changes in language and rhetoric are reminders that the FOMC and the Federal Reserve are not only responsible for adjusting interest rates, but also setting expectations when it comes to future moves.
In other parts of the statement, it was mentioned that the risks to achieving the dual mandate are gradually becoming more balanced. For the first time during this cycle, the FOMC emphasized its focus on both the max employment and price stability mandates. Previous statements only focused on fighting inflation. These various changes in language make the FOMC’s statement lean dovish and bolster expectations for a September rate cut.
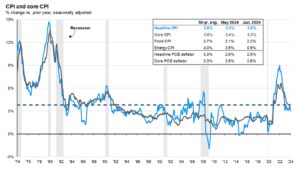
There are reasons why the committee feels more confident in inflation coming down. Headline PCE inflation (the Fed’s preferred inflation gauge) fell to 2.5% year-over-year in June, down significantly from a peak of 7.1% two years ago. Chairman Powell emphasized the quality and broadness of disinflation in areas such as housing and other services. This allows the Fed to shift its focus from just inflation to overall economic growth and the labor market. The FOMC’s next meeting is scheduled for September 18th, with the market fully pricing in some sort of cut, but still split between whether it will be 0.25% or 0.50%.
Headline and Core Inflation Over Past 50 years

Source: JPMorgan Asset Management

 Previous


